As UX designers, we’ve all heard the age-old question: “How do UX Design help the business?” If you’ve ever had to explain how a smoother checkout flow or fewer clicks to a feature impacts the bottom line, you’re not alone. Aligning UX design with business objectives can feel like translating two different languages, and defining how to measure the results is also a big challenge, but when done right, it’s a powerful way for driving both user satisfaction and company success.
In this article, I’ll share why aligning UX metrics with business KPIs is essential, how to do it effectively, and some real-world examples to make it actionable. Let’s dive in!
Why UX Metrics and Business KPIs Must Align
Let’s start with the basics: UX metrics measure how users interact with a product, while business KPIs gauge how well the business achieves its goals. These two sets of metrics might seem unrelated at first glance, but they’re deeply intertwined.
For example, imagine an e-commerce site where customers frequently abandon their carts at the checkout stage. From a UX perspective, this might signal usability issues like confusing forms or a lack of trust signals. From a business perspective, it’s lost revenue. By improving the UX—say, simplifying the form or adding trust badges—you not only enhance the user experience but also directly impact the business KPI of revenue.
I’ve seen this alignment firsthand while working on a mobile banking app. The goal was to reduce customer support tickets, a clear business objective. By analyzing user flows, we discovered that users struggled to find the “forgot password” feature. Adding a more prominent placement reduced support tickets by 15%, solving both a user pain point and a business challenge. This taught me that UX isn’t just about making things look good—it’s about measurable impact.
The Hidden Cost of Ignoring UX Metrics
It’s worth mentioning that failing to align UX metrics with business goals isn’t just a missed opportunity—it can actively harm the business. In one case, I worked with a team that overlooked usability issues in favor of flashy new features. The result? High user churn, complaints about confusing workflows, and a 20% drop in active users over six months.
This experience taught me a valuable lesson: neglecting UX metrics is like sailing without a compass. You might still be moving forward, but there’s no guarantee you’re heading in the right direction.

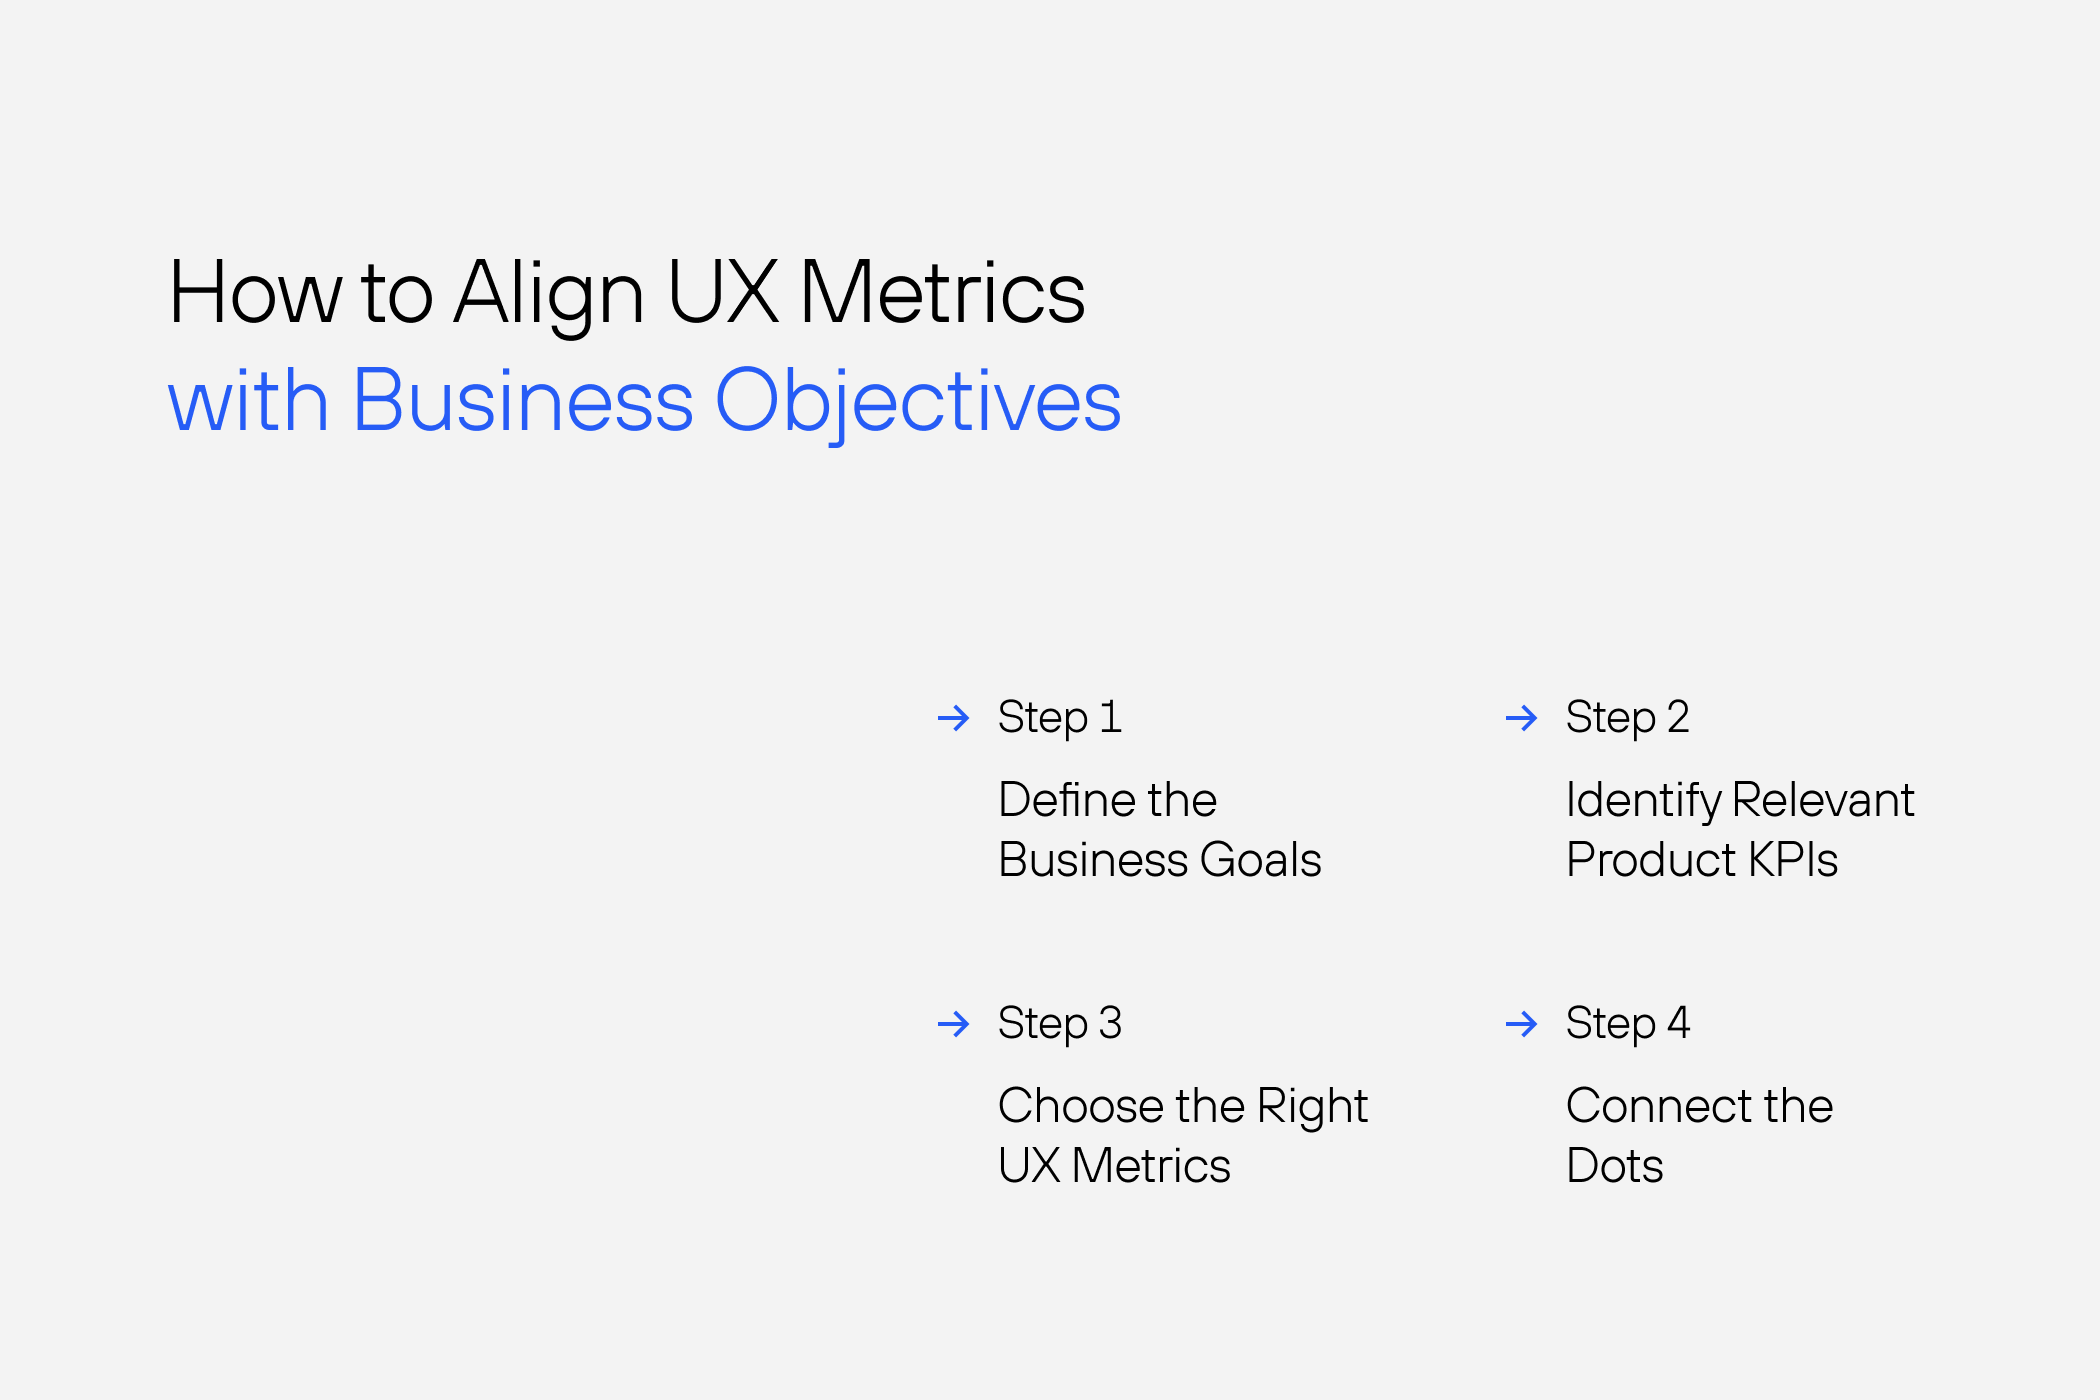
How to Align UX Metrics with Business Objectives
Step 1: Define the Business Goals
Before diving into UX improvements, you need clarity on the big-picture objectives. Is the company focused on growth? Retention? Operational efficiency? These goals set the stage for everything else.
For instance, during a project for a SaaS product, leadership made it clear that retaining users during onboarding was a top priority. That focus helped us zero in on UX metrics like “time to value” (how quickly users achieve their first meaningful interaction). By reducing time to value, we aligned directly with the retention goal.
Pro Tip: If business goals feel vague or disconnected from UX, ask clarifying questions during planning sessions. Sometimes, leadership has a clear vision but hasn’t articulated it in actionable terms. Your role is to bridge that gap.
Step 2: Identify Relevant Product KPIs
Next, map the business goals to specific product performance indicators. If the goal is growth, product KPIs might include user acquisition or feature adoption rates. If it’s efficiency, you might track how long it takes users to complete key tasks.
This step is where collaboration with product teams becomes crucial. In one project, I partnered with a product manager to improve the onboarding flow of a health-tech app. Their KPI was a higher percentage of users completing onboarding. We used this to guide our UX focus, tracking drop-off points and usability scores to refine the flow.

- Step 3: Choose the Right UX Metrics
Now comes the fun part: selecting the UX metrics that influence your chosen KPIs. Here are a few common pairings: - Task completion rate → Conversion rate
- Net Promoter Score (NPS) → Customer loyalty
- Error rate → Operational efficiency
- Time on task → Productivity
Let’s take the earlier example of onboarding retention. We measured task completion rates during onboarding, focusing on where users dropped off. By simplifying the steps and adding contextual tooltips, we increased task completion rates by 20%, which directly impacted the product KPI of onboarding completion. This is a clear example of how UX metrics drive business impact.
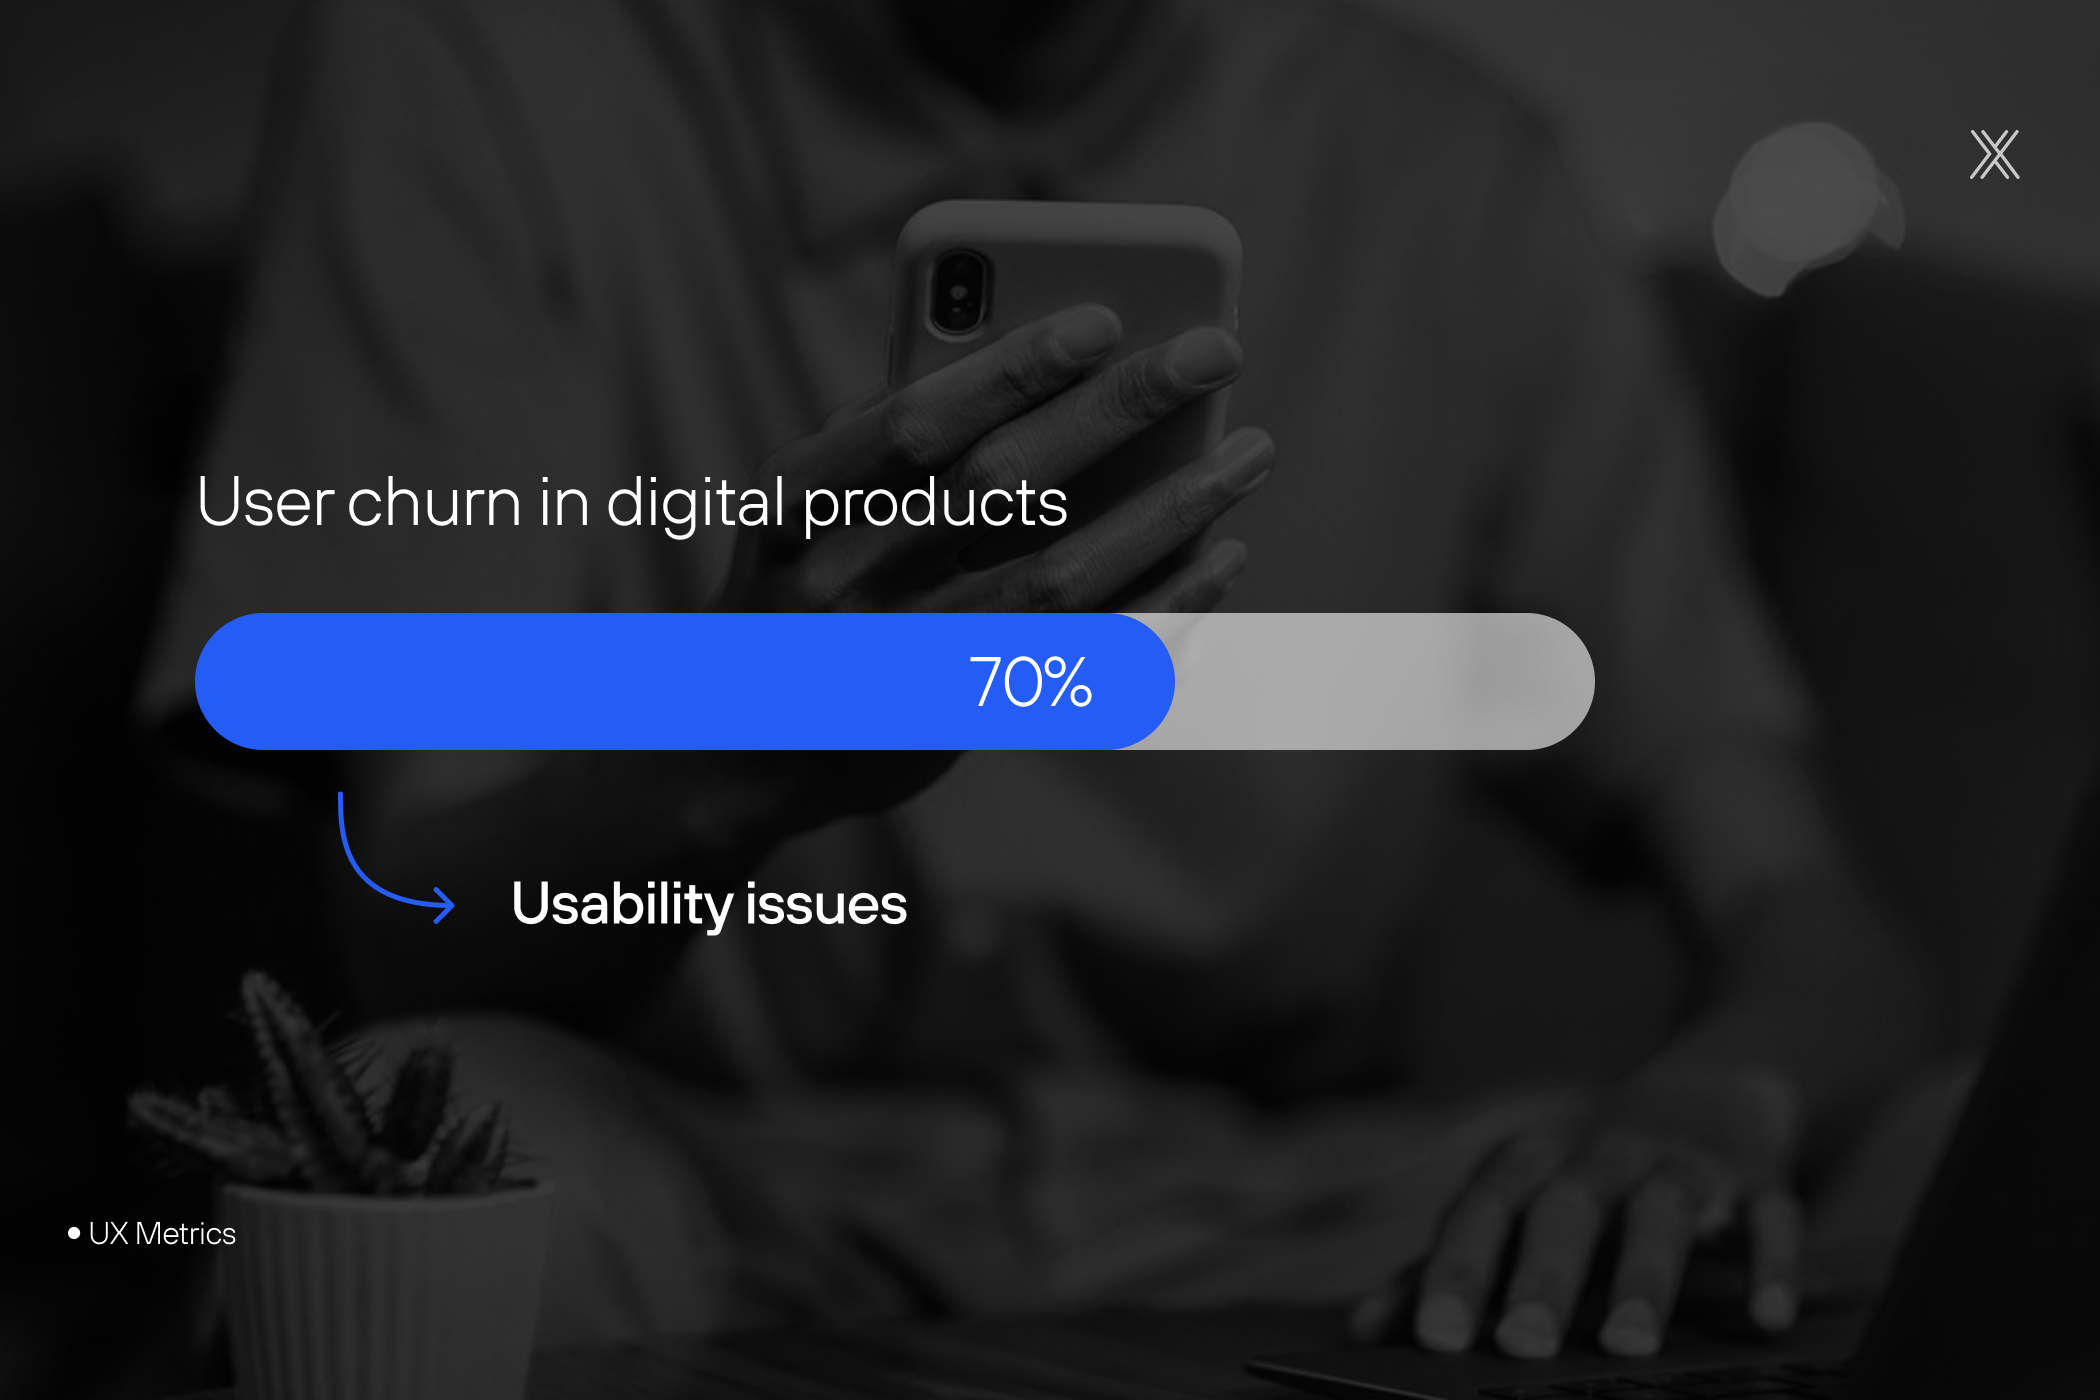
Did You Know? Research shows that usability issues account for up to 70% of user churn in digital products. Prioritizing UX metrics not only improves user retention but also saves money on re-acquisition efforts.
Step 4: Connect the Dots
This is where the magic happens. You’ve defined the business goals, identified product KPIs, and selected your UX metrics—now it’s time to tie them together. Use data analysis to show how changes in UX metrics correlate with business outcomes. A/B testing is your best friend here.
In the health-tech app project, we ran an A/B test on the onboarding flow. Group A used the original design, while Group B experienced the improved version. The results? Group B showed a 15% increase in onboarding completion and a 10% higher retention rate after 30 days. Presenting these numbers to leadership made it clear how UX metrics drove business success.
Real-World Examples of Metrics Alignment
Example 1: E-commerce Checkout Flow
- Business Goal: Increase revenue.
- Product KPI: Higher checkout completion rates.
- UX Metric: Task completion rate.
By simplifying the checkout process—reducing the number of steps and adding autofill for payment details—a retail client saw a 25% increase in completed transactions. The improvement was measurable and directly tied to the business goal.
Example 2: SaaS User Retention
- Business Goal: Improve customer retention.
- Product KPI: Monthly active users (MAUs).
- UX Metric: Time to value.
For a SaaS tool, we created an interactive onboarding tutorial that guided users to their first meaningful interaction within five minutes. This reduced churn during the first week by 18%.
Example 3: Mobile Banking Error Reduction
- Business Goal: Enhance customer satisfaction.
- Product KPI: Fewer customer support tickets.
- UX Metric: User error rate.
By redesigning the transaction flow and adding clearer error messages, we cut down on user mistakes by 30%. Support tickets related to transactions dropped significantly, aligning with both user and business needs.
Overcoming Common Challenges
Challenge 1: Gaining Leadership Buy-In
It can be tough to convince leadership of UX’s value. The key is storytelling with data. Share case studies showing clear ROI. For example, that 25% increase in e-commerce transactions? A compelling story with numbers speaks volumes.
Challenge 2: Measuring Subjective Metrics
How do you measure something like user satisfaction? Combine qualitative feedback (like user interviews) with quantitative data (like NPS). Together, they paint a full picture.
Challenge 3: Breaking Down Silos
Collaboration is non-negotiable. Host workshops or create shared dashboards where UX, product, and business teams can see how their metrics influence each other.
Tools and Techniques for Success
- Tools: Platforms like Google Analytics, Hotjar, and usability testing tools (e.g., Maze, UserTesting) help track UX metrics effectively.
- Dashboards: Create real-time dashboards to visualize how UX metrics influence KPIs. Leadership loves seeing numbers at a glance.
Takeaway: A well-maintained dashboard isn’t just for tracking progress—it’s a tool for building trust with stakeholders and fostering transparency across teams.
Conclusion
Aligning UX metrics with business KPIs isn’t just a nice-to-have—it’s essential for creating user-centered products that drive measurable success. By defining clear goals, selecting the right UX metrics, and connecting the dots with data, you can show how great UX directly supports business objectives.
So, the next time someone asks, “How does this design help the business?” you’ll have the answer—and the UX metrics to prove it. Ready to start aligning? Let’s make it happen.
